One Dashboard to Rule them All. Prize.
What exactly is this post about? Task.
A 100.000$ task on 1729.com, something we have never seen before. It created a big hype, especially in our cool “underground” 1729 Community Discord channel (dm for an invite link). A lot of bright minds started forming teams to solve this ambitious task. While teams were forming, a furious debate about the $100k prize started. One half of the pseudonyms, mostly from wealthier nations, argued that the labour costs of a full developer team far outweighed the compensation for such a heavy task. The other half, mostly from developing countries, said that this big project was an opportunity of a lifetime for them and winning the challenge would set them financially for some years.
Nevertheless, both parties agreed one one thing: if this task could be solved, the benefit people would experience from such a tool would be far more valuable than the bounty of $100k.
But what is this grandiose task I am teasing here? Problem.
A censorship-resistant, decentralized, inflation dashboard.
And why do we need such a dashboard? Need.
As mentioned in the article, trillions of monies have been printed by our governments over the last years. This indicates that inflation might be caused by the government. If so, we should not rely on governmental statistics anymore, because let's be honest, when was the last time they admitted that they were the catalysator of a problem. Moreover, as stated by the original article, in places with high inflation, censorship and denial is the rule rather than the exception.
If you do not want to hear it from me. Listen to Paul Graham’s words journalists and politicians: “They didn't realize there was any danger in making false predictions. These people constantly make false predictions, and get away with it, because the things they make predictions about either have mushy enough outcomes that they can bluster their way out of trouble, or happen so far in the future that few remember what they said.”
Not enough, or too complicated? Let Michael Burry explain it in simple words specifically about the problem we are trying to address here:

To build or not to build? Motivation.
The reasons shown above are strongly in favor of building a maximally government-independent, on-chain, inflationary dashboard. Yet, really creating a well-thought through dashboard, is a heck of a task. Obviously, after reading this task, my friend A. Shmachkov and I were eager to participate in this battle for a censorship free world. However, we did not create a decentralized knock-off version of MIT’s Billion Prices Project. Rather we created a simple but smart formula that would calculate the current inflation value, based on government independent inputs. Due to our time constraint of both of us having double-fulltime-jobs, we decided not to deal with all the issues of crawling that many web pages, but rather came up with a different approach to derive the inflation value. Even though our approach might not be as sophisticated as requested, we hope to contribute in a more theoretical approach and develop this idea further if it sparks interest.
How does our Inflationary Dashboard MVP work? Approach.
Our approach was initially structured as a hypothesis test on a single country. A kind of MVP. The basis for our hypothesis was the inflation function itself . We argue that the inflationary function is a phenomenon of two inputs - monetary measures and social behaviour. Inflation can happen if the government starts printing more money or because of mass psychology, if just enough of the right people start believing in it. Hence, currently, inflation is measured in two parts. Firstly, by a consumer price index (CPI). Secondly, by mass polls, which measure the psychological aspect and belief. Unfortunately, there are two big flaws with this approach, the CPI is not very robust over multiple countries, as the availability of products differs and it takes a long time for the opinion polls to be evaluated.
Consequently, we needed to choose better parameters, which would estimate the value of inflation. We chose three main of criteria for our parameters:
- Universality
- Generally accessible
- Relevant
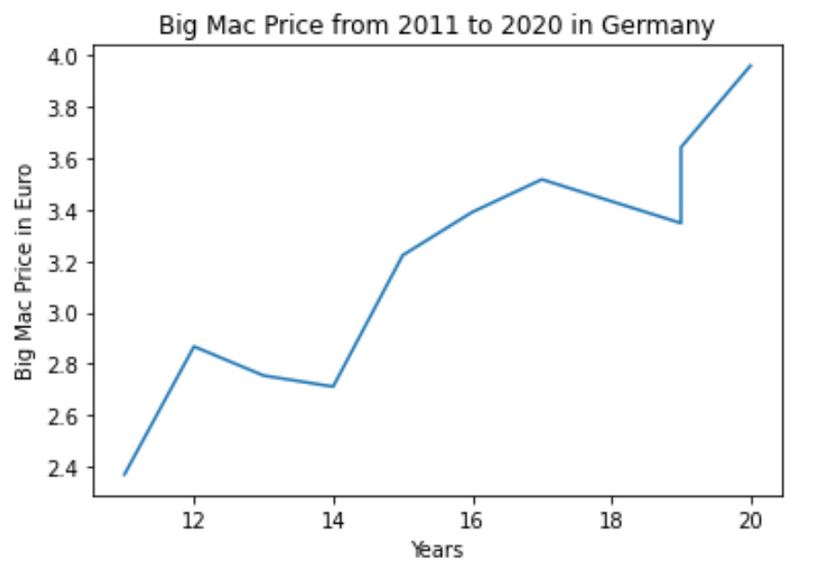
Inflation shows the change in prices, so one of the parameters must be related to prices. In this work we have settled on the Big Mac Index, as it is available and is calculated for all countries, and besides, it is more universal, as it reflects the cost of a kind of analogue of multiple consumer baskets. And unlike Amazon and other online retailers, it is available in all countries. Thus, taking the Big Mac Index, you can estimate the value of inflation in the food sector quite accurately.
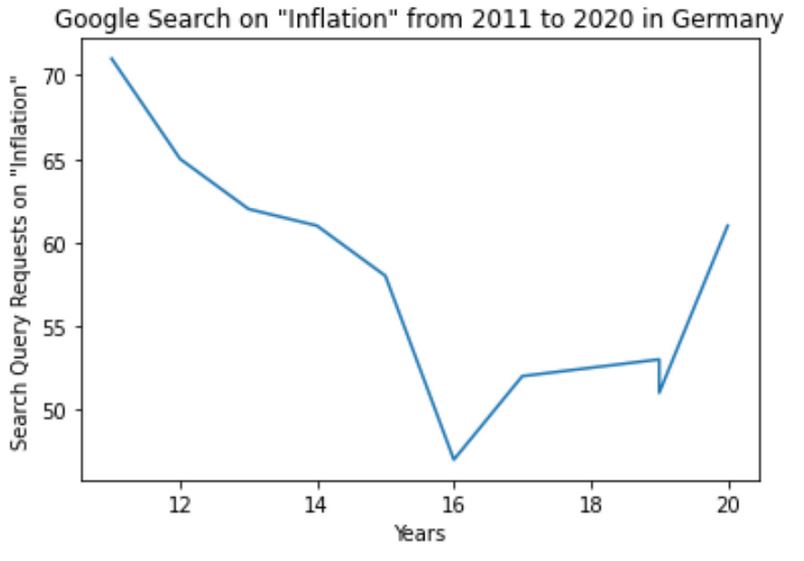
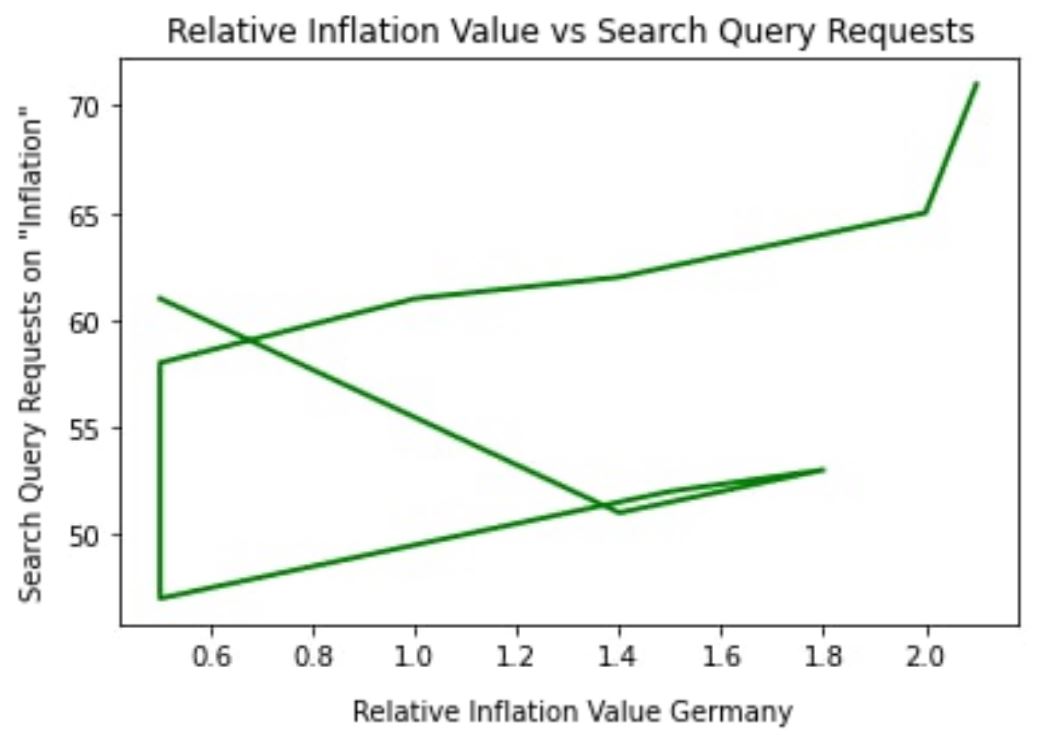
The second parameter is a psychological factor. The psychology factor is also invested in inflation in a certain way. The most appropriate parameter is the number of queries on "inflation". Several research papers have already proposed this approach and showed quite promising results. You can definitely see a correlation between inflation and the spike in search query statistics. As Google is used globally, with the exception of some countries, we take Google’s trend data as our input. The last, third parameter, is the time factor as money depreciates over time.
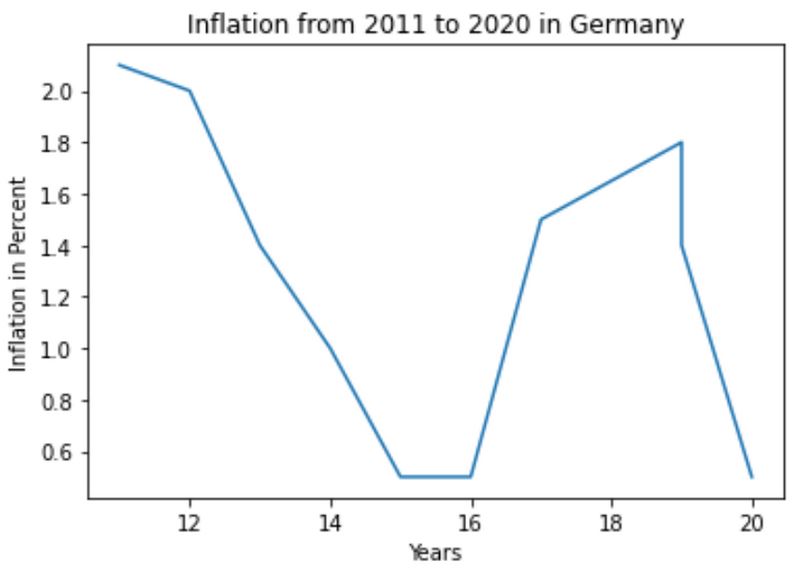
After deciding on the parameters for our study, we needed to define a test case. For our hypothesis test, we chose Germany because of two reasons. Firstly, we had easy access and prior experience of getting statistical data about Germany. Secondly, Germany consistently ranked in the Top 10 of the least corrupt countries, which allows us to presume that the statistical data should not be too far off.
As for the method, we chose to use a regression analysis. The data we used for the Big Mac Index, Inflation and Search Queries, ranged from 2011 to 2020.
We built an analysis matrix consisting of unit columns, date columns, the value of the Big Mac Prices on those dates, and the number of queries (matrix A).
We obtained an equation of the form:
A * θ = Y
Where the matrix-vector θ-shows the relationship between the variables (Time, Big Mac Prices, Search Queries) and the value of inflation. The vector y is the vector with the values of inflation. Then we found a pseudo-inverse matrix from matrix A (matrix A is not always squared) :
The pseudo-inverse matrix is a generalization of the notion of the inverse matrix in linear algebra. It is denoted by A+.
A+ = (AT * A)-1 * AT
And we get an expression for the coefficient matrix:
θ = A+ * Y
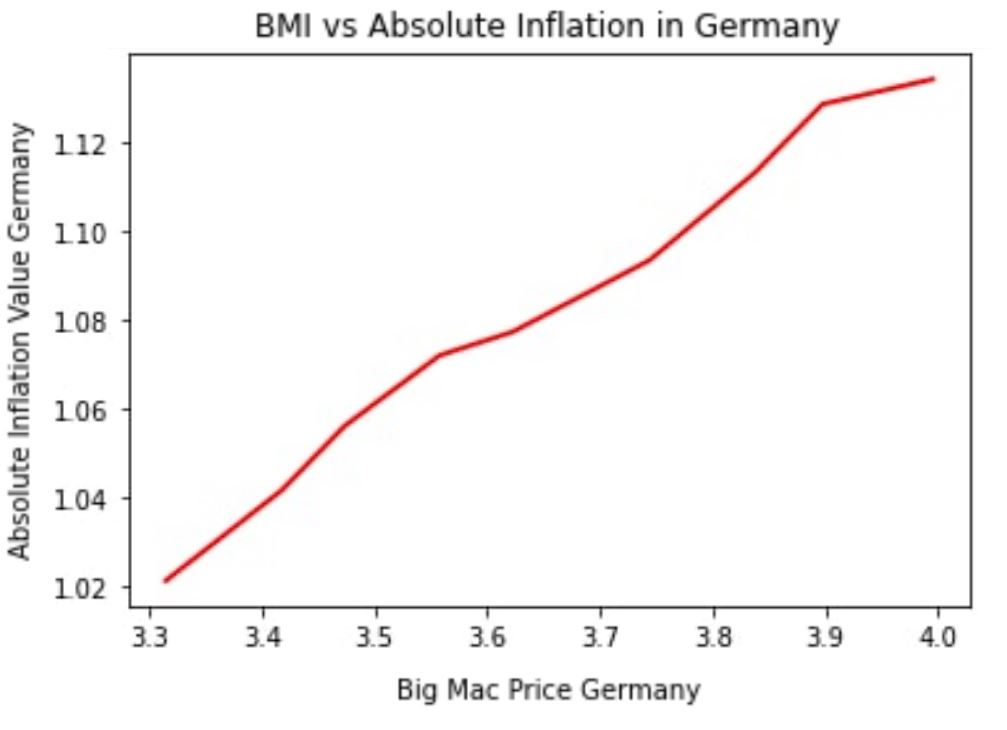
Next, you just need to substitute a new vector of values and multiply it by the vector θ. To obtain the vector you need to know the actual values of the Big Mac Prices and Queries.
You can find the Big Mac in two ways: find it using the Internet, or calculate it using the same regression or polynomial method. (It is worth noting that the polynomial method will give us a larger error from the real one than the regression method). For Germany we obtained a value of 4,49% for the end of year 2021. This is very close to the real value of 4.5% reported by the german government in October. (the value for October of 2021 was reported to be around 4.5%). The interesting point here is that if we derive the inflation value for the whole Euro Zone it states 4.13% or even higher, however the value reported by the EU government is around 3.4%. This could indicate that other countries where corruption is higher do not report correct inflation values.
What else did we try? Further Steps.
We tried multiple algebraic methods for this small study. For example, we created a polynomial interpolation method. However, the polynomial method has a discrepancy due to the constantly changing trend. The method of interpolation through differential equations gives a similar picture. The method through Harmonics and Fourier series is unreliable, because the periodicity of growth cycles changes, due to stressful scenarios both in a particular region and around the world.
As shown above, the best method prevailed to be a simple regression analysis. The results estimated an inflation value of around 5.5%, which is very close to the inflation value reported by the German government.
For the next steps, we thought about adding other parameters and tailoring the function to specific regions or countries. The ECB refinancing rate shows to be a promising parameter for the Euro Zone for example. Even though our function/approach are still not the holy grail of calculating inflation and need more finetuning, it shows promise. Perhaps it might be used as an additional measure for a more sophisticated function that might be developed in the future. If you are interested to know more about the ideas we have on the development of a more sophisticated function, you can contact us via DM.
Want to try the script for your country? Code.
Here is the link to our Google Drive, where you can download our python script and test it locally. Also we included all the statistical data on the Big Mac Index, Inflation and Google Search Queries in the folder for you to download and play around with different inputs.
Inflation and the Individual. Epilogue.
Hopefully, while reading this post you understood that it was not only an attempt to propose a different way of calculating inflation and creating an MVP of a censorship-free dashboard. This post is also an appeal for you to start thinking critically and acting independently. Let me explain why I urgue to do that with an example of the interaction between "Inflation" and the "Individual".
The free market where goods and services are facing ever more competition while becoming more independent, is already partly changing the very concept of inflation. It is ever more becoming a matter of the individual rather than the global. But it is worth noting that a sharp transition must take place first of all in the consciousness of the individual, and then already in the consciousness of society.
In addition, most people are not so much interested in inflation in the usual sense of the word as in the growth of the "CPI". These days we see the interaction of progress and marketing, and we see both symbiotic interaction and confrontation. New tools are coming into play, and these very tools are evolving and disrupting all the time. One of these tools is the concept of private money like specific cryptocurrencies, which is changing the world we are used to at an increasing pace.
We must also point out, that changes you might think of are only a consequence of other more fundamental changes (e.g. We cannot see genetic changes in a DNA molecule without special equipment, but we can see the external changes after some time if not immediately).
Previously, the concept of money was mostly state-owned until the advent of cryptocurrency. Thus, the progress started where everything associated with money also ceases to be exclusively state-owned. And inflation is no exception. We should not rely on what we are told on TV anymore, like for example that inflation rose or fell a certain amount of percent. Rather we should convince ourselves on the example of our own wallet or personal "CPI".
As for the final words, I want to thank my friend and main author of this post, Alexey Shmachkov. It was great fun seeking a solution for an Inflationary Dashboard MVP with you. May you find the truth (and the force...obviously) in all of your beginnings. If you have any questions for Alexey or want to work with him in the areas of mathematics, physics or computer science, drop him a message on [email protected].